
Photo by civic engagement storyteller Xavier Boone.
It’s time to start your day.
You’re ready to head out and face the world. What is your form of transportation?
Public Transport
Perhaps you are a New Jersey Transit light rail or bus commuter. A bus stop could be a 10-minute walk from your house while the light rail could be a 25-minute walk. So, for most, that choice is probably already made for you.
Danielle Grant, who has lived in Jersey City for over 20 years, compares her experience with public transportation’s convenience to her time in Brooklyn — “a train station was always three blocks away.”
Automobile
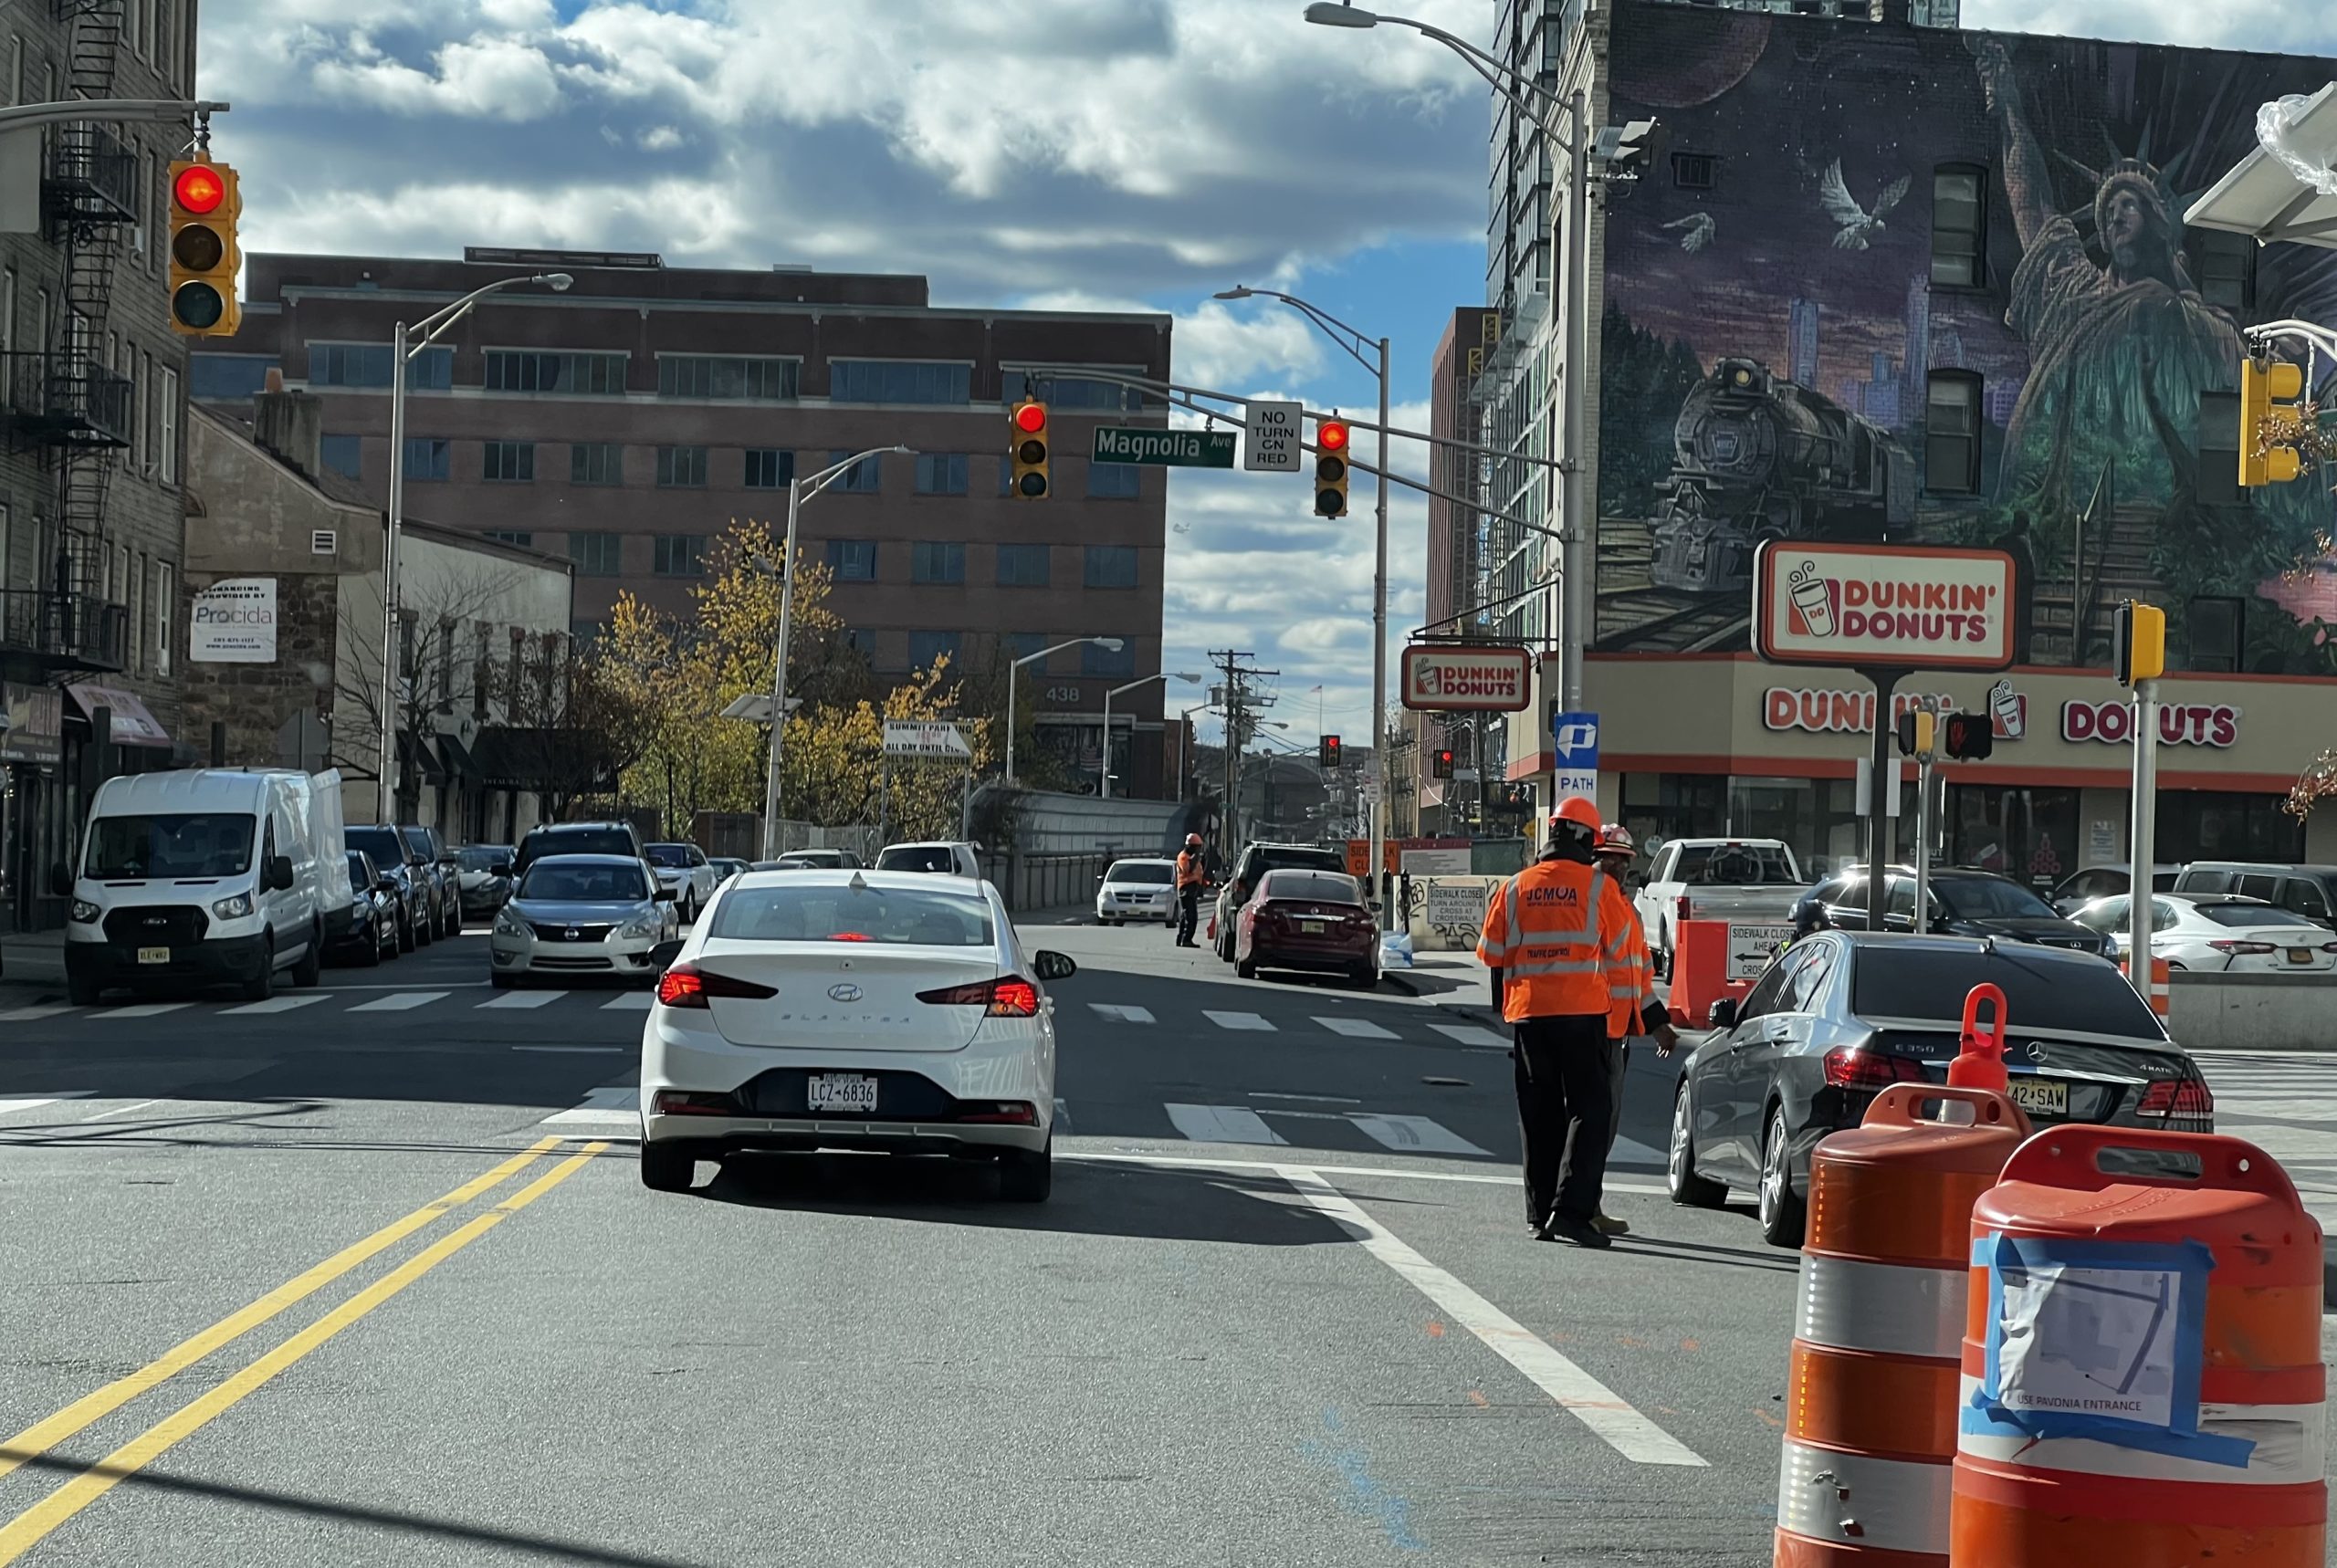
Maybe you have a car. If you commute by car in the city, all we have to say is — good luck.
Grant who uses the NextDoor app –a social networking service that connects neighbors based on their location — has “seen approval for (building) developments without parking garages.” Parking is a big form of neglect in her side of town.
“It isn’t getting the same respect as the development that is being built or has been built downtown.”
Mass migration to Jersey City has increased the population by approximately 45,000 individuals between 2010 and 2020 and 62% of the households in Jersey City had access to a car in 2020.
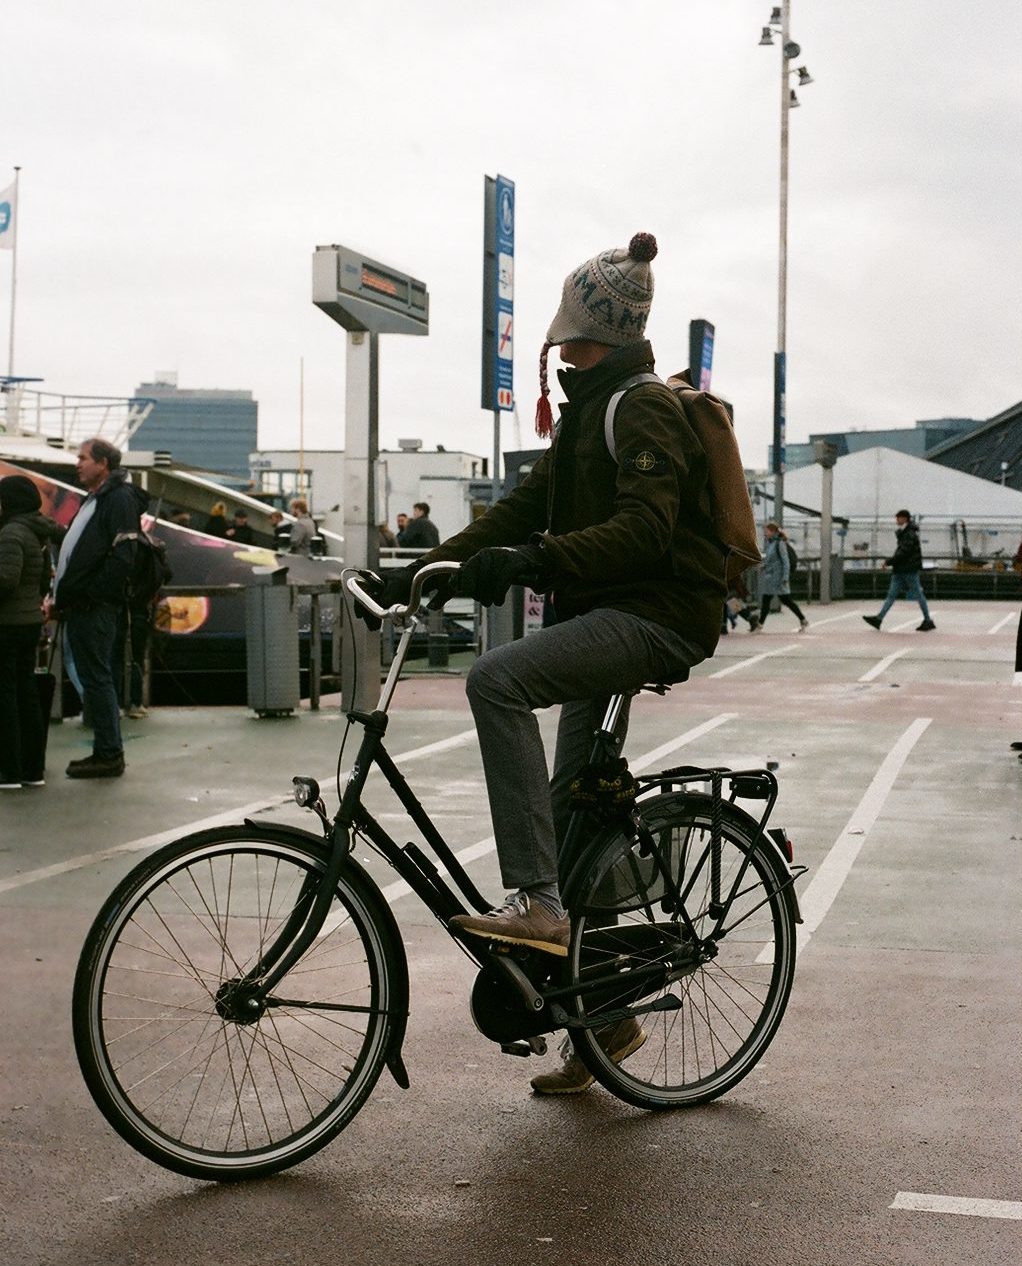
Bike or Scooter
It could be that you are the happy medium and own a bike or a scooter.
Bike lanes have been establishing themselves all over the city, allowing cyclists to cruise through the traffic and road congestion on bad days. The bike and scooter commute also appears to be the safest form of transportation.
Although 17 incidents happened in 2022, Hudson County had 0 pedal-cyclist fatalities.
If you’re hopping on one of these, bundle up and try to share the road with automobile drivers. (We know you guys have a complicated relationship).
While Hudson County commuters still learn how to share the road, it seems that one city was able to find a method that works.
In 2023, Hudson County reported 24 fatal accidents with 26 fatalities in total: 11 drivers, three passengers, three bicyclists and nine pedestrians. Not one comes from Hoboken.
Generally, areas with higher population density tend to experience more car accidents. Population density refers to the number of people living in a given area, often measured per square mile or square kilometer. Several factors contribute to the correlation between population density and car accidents like traffic congestion, intersection density, pedestrian activity and parking.
In the U.S., an estimated 42,000 people died in motor vehicle traffic crashes in all of 2023, a decrease as compared to 32,000 fatalities in the first half of 2022.
Despite Hoboken’s population of approximately 57,000 citizens, sharing an approximate land area of about 1.28 square miles or around 3.32 square kilometers, the city reports 0 traffic deaths in 4 years.
Vision Zero
Hoboken adopted a European approach that displaces the responsibility for pedestrian safety.
The traditional approach lies the responsibility of the pedestrian on the individual. Clear roads, efficient through-traffic and safe crosswalk practices in a perfect world, works.
According to the Vision Zero Network, “Vision Zero is a strategy to eliminate all traffic fatalities and severe injuries, while increasing safe, healthy, equitable mobility for all.” This was first implemented in Sweden in the 1990s.
Vision Zero was introduced to Jersey City in 2019 and the city has completed 50 out of 77 actions outlined in the Vision Zero Action Plan.
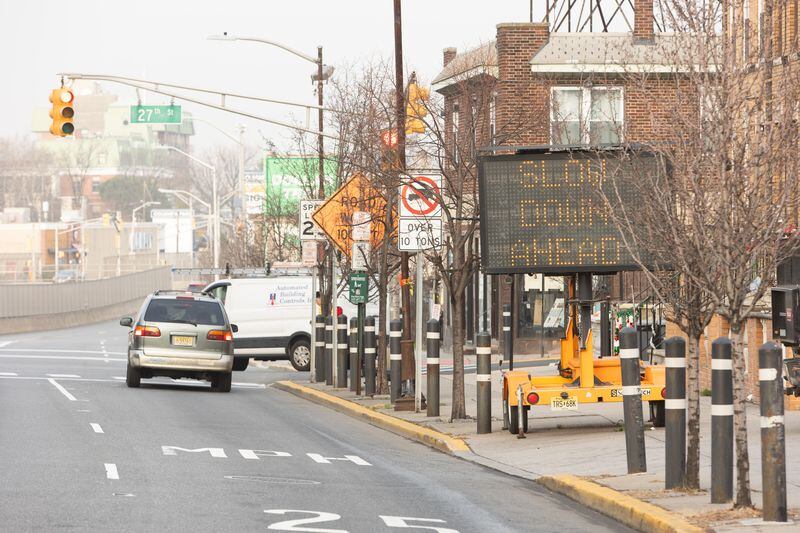
New speed bumps, 183 new “no turn on red signs” and over 100 new curb extensions have aided this plan with meaningfully, well directed intent that indirectly inconveniences one type of commuter: drivers.

- New York, New York — 45.6%
- Newark, New Jersey — 59.7%
- Washington, District of Columbia — 62.7%
- Jersey City, New Jersey — 62.9%
- Cambridge, Massachusetts — 63.2%
- Boston, Massachusetts — 66.2%
- Paterson, New Jersey — 67%
- Hartford, Connecticut — 67.4%
- San Francisco, California — 70.1%
- Philadelphia, Pennsylvania — 70.5%
With the majority of Jersey City homes owning cars, this could mean there needs to be more methods of intervention like:
- Leading Pedestrian intervals
- No turn on red signs
- Slower speeds
- One Way Streets
- Speed Bumps
- Traffic Choke Points
- Emphasized Cross-Sections
When analyzing the 2022 Jersey City annual report, 2022 appears to be the first year since its adaptation that has shown significant progress when accounting for Fatal Traffic Crashes and Serious Injury Crashes.
However, there’s still room for improvement, especially since the 26 fatalities are nine more than 2022 and is near the recent high of 30 in 2021.
While Vision Zero has been credited–by some–as a step in the right direction, many locals still advocate that in order for all commuters to be safe:
- Drivers must be held accountable for breaking traffic laws
- Cyclists must be held accountable for breaking traffic laws
- Only then — the city can be safe without targeted inconvenience
A Mode Shift
A mode shift calls for a mass reprogramming, migrating from automobile reliance to bikes, public transportation and other alternatives.
Exclusive bus lanes could make public transportation services faster, efficient and more attractive, but more expensive, like the exclusive bus lane at the Lincoln Tunnel on John F. Kennedy Boulevard. With the city’s streets being limited in space, congestion ensues.
The first step would be to improve reliability which would enforce an increased dependency, but better service also comes with higher fare pricing.
A Counter-Solution: Widen the Turnpike
The population of Hudson County is growing and a 294 page study predicts 170,000 new residents and 67,000 more jobs to be introduced to the region. To cope, the state is planning a major Turnpike Widening Project.
Hudson County Streets, an organization that advocates for accessibility for pedestrians, bikers and commuter, is in direct opposition to widening the turnpike as it would be an environmental nightmare and taking money that could be used to improve the public transportation system.
According to NorthJersey.com, “the project as a whole is an 8.1-mile portion of the Turnpike between Newark, Jersey City and Bayonne that will expand certain parts of the elevated highway and replace 29 bridges at an estimated cost of $10.7 billion, paid for through bonds paid back by tolls.”
People love their cars, and with an increase in population comes an increase in vehicles. Approximately 92% of American households have had access to at least 1 car in 2021, the widening of the turnpike is the state’s solution to a growing problem without imposing a lifestyle change on its residents.
Let’s get back to your day — this time in an ideal world.
After leaving your house and making your way to a bus stop or one of the numerous convenient light rail stations that do not yet exist, you’d have multiple NJ transit options at your disposal. Frequency of service would be every 5 to 15 minutes and brief commutes with buses never in traffic and light rails never delayed and pedestrian scrambles at your local intersection playing a part in the community’s safety.
Instead you decide to drive your car, traffic isn’t heavy, cyclists are following all traffic laws that apply to motorized vehicles like Improper passing and there’s always parking.
Although bicycles aren’t vehicles on the road, “cyclists have the same duties as drivers,” which means that “cyclists have to signal before making a turn, stop at all red lights and stop signs and give pedestrians in the crosswalks the right of way.”
Jimmy Lee, president of Safe Streets JC, an advocacy group supporting Vision Zero’s mission to maintain a zero pedestrian death toll, told Slice of Culture that although there was a significant increase in accident fatalities comparing 2023 to the previous year, none of the accidents have taken place in areas that “have seen Vision Zero Intervention.”
With closer inspection, the majority of those accidents take place on county and state roads.
Most of which have heavy highway traffic at almost any time of the week. Highways and neighborhoods may have similar pedestrian safety issues, but different surrounding environments, traffic, and functions require individual solutions.
Without inconveniencing the flow of traffic and increasing safety, pedestrian bridges may prove to be as impactful as highways and state roads cannot be treated like those within neighborhoods.
For other locals, like Jersey City native artist, Ojuang Mayeng, pedestrian safety also seemed to be one of their main concerns.
When asked about the changes to infrastructure he stated “Jersey City trying to accommodate pedestrians is a good thing.” He went on to express that he’d like the overall speed within the city to decrease.
Emmanuel Morgan, co-founder of Hudson County Streets, told Slice of Culture “Walkable, bikeable cities create economic vitality, imagine if Journal Square wasn’t an eight-lane highway. The small businesses would thrive.”
She goes on to say, “Kennedy Boulevard is hostile to pedestrians, because of the speed of the traffic” and “County rd 139 is the same way.” Both are county and state maintained roads relinquishing Jersey City’s jurisdiction.
It seems to be that Hudson County is looking to continue striving for better pedestrian safety. It was recently announced that the county was awarded nearly $90,000 from two separate grants to improve traffic and pedestrian safety. The first grant, which is $60,000, will be focused on pedestrian safety while the second, of $38,180, will fund a County program to combat driving under the influence (DUI) and aid in prosecution or conviction of offenders.